Monitoring – Public
Perfsonar
We run a perfsonar end-point for the WLCG/GridPP/JISC community. This is setup with 2x40GB NICs in a redundant way with a 4x10GB uplink.
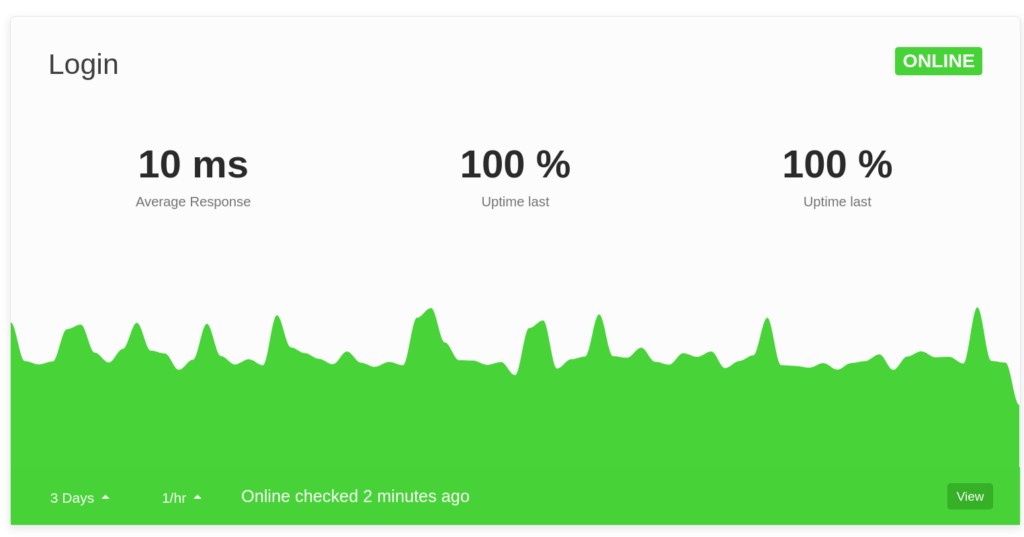
Statping-ng
We run a small instance of statping which periodically checks specific services to check the availability.
This service is hosted in the grid and so reflects viability of services from the grid, which may not reflect its actual status internally.
Our statping is here.
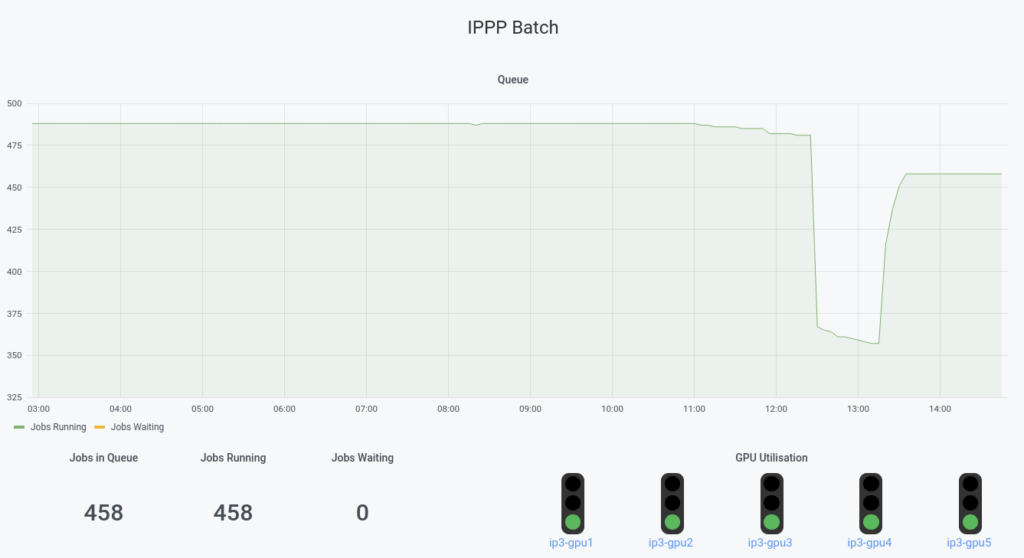
Grafana
We have a single public end-point for our monitoring which may be helpful to view resource usage called grafana. Grafana aggregates and displays monitoring data from multiple sources using multiple different tools.
We have split out our dashboards to Buildings, IPPP, Grid, Grid (WLCG), Displays and Other. The dashboards under displays are aimed at being views on displays, everything else is aimed at user web browsers.
This service is hosted in the grid and IPPP and as such should reflect the internal state, so issues with internet connectivity may not be reflected correctly.
Our grafana is available here.